Discounts
5% point-of-sale discount + 2% quarterly volume rebate

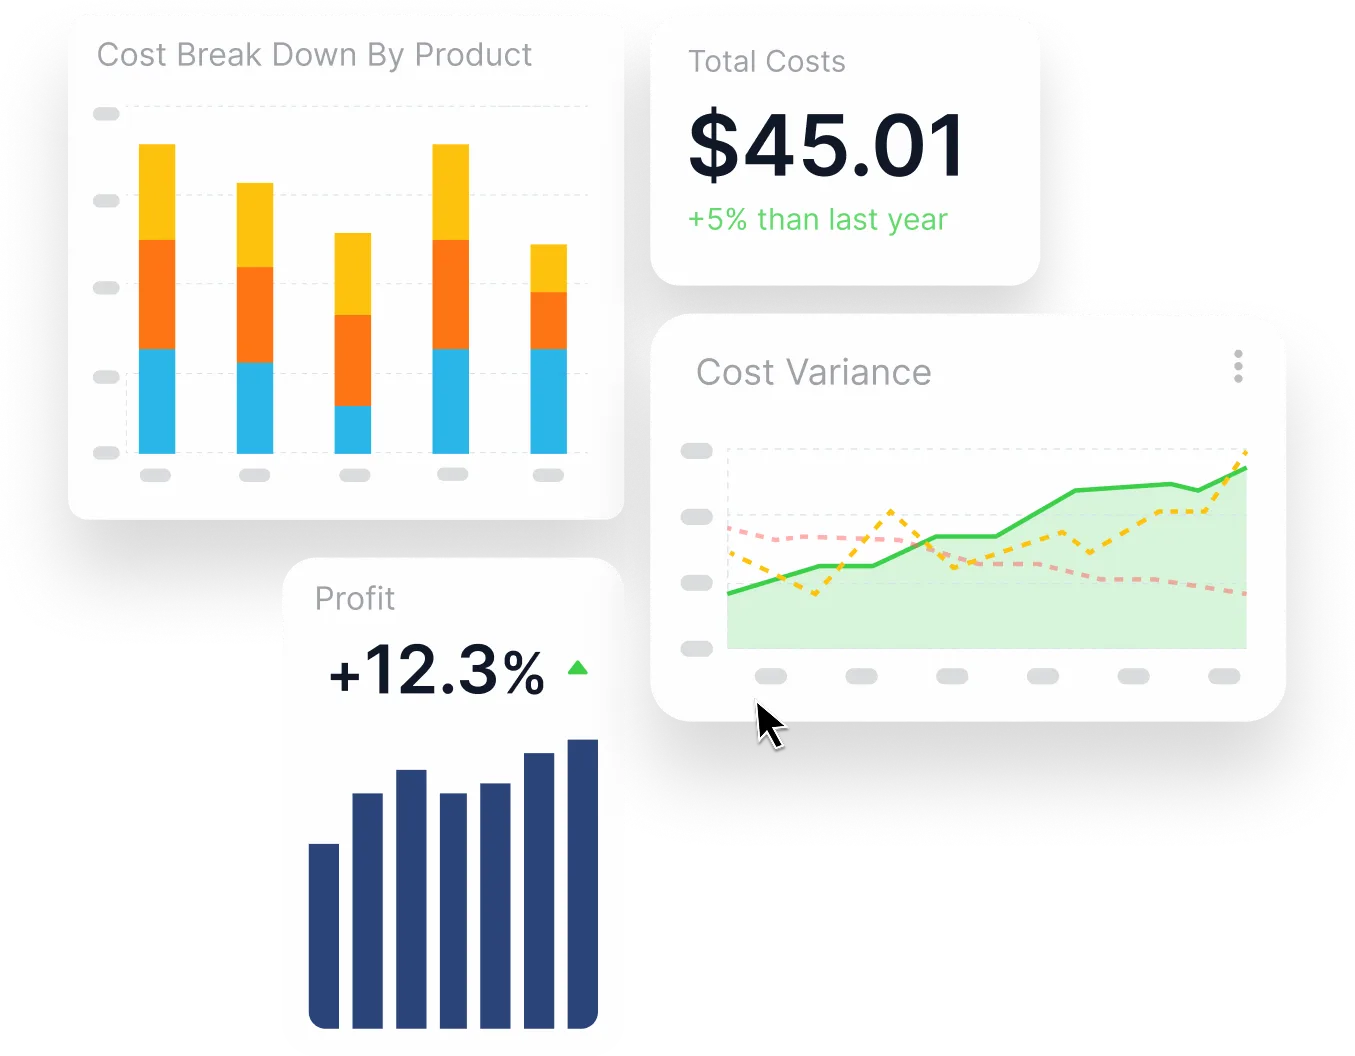
Drive efficiency in your business by knowing your operating margin and net margin by customer, product, and channel. The PlaidCloud Profitability & Cost Management solution calculates and shares customer profitability and product profitability information.
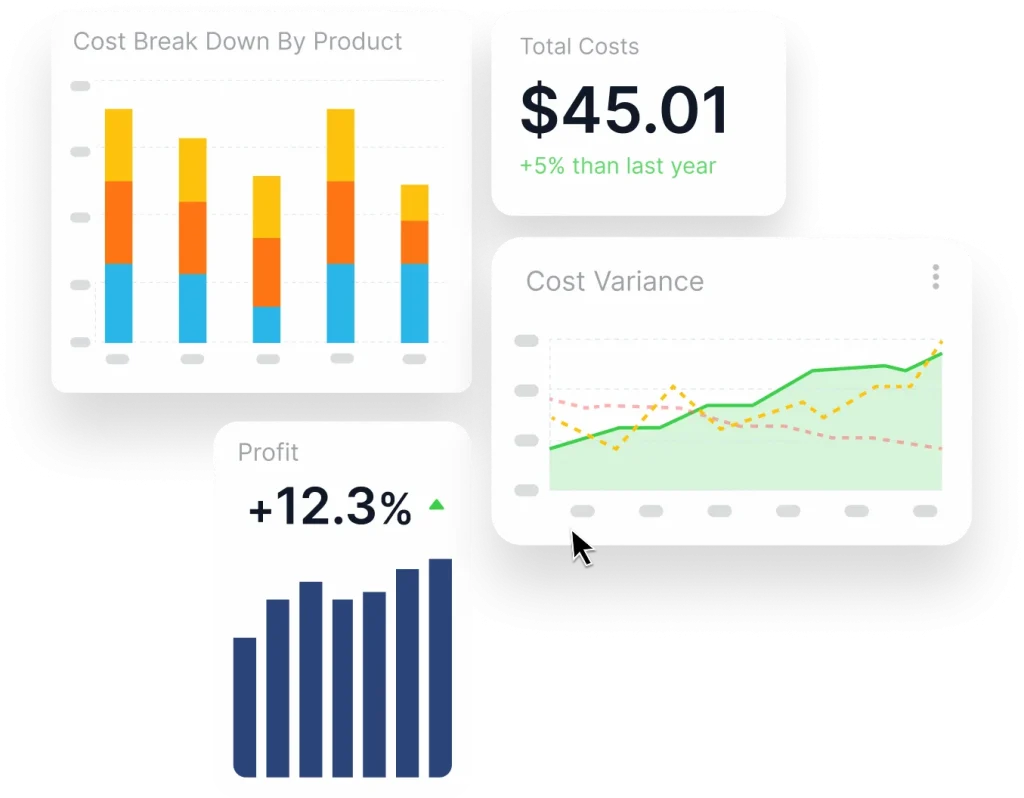


From Raw ERP Data to Fully Loaded Net Margin
Operating Margin and Net Margin for Every Unit of Sale
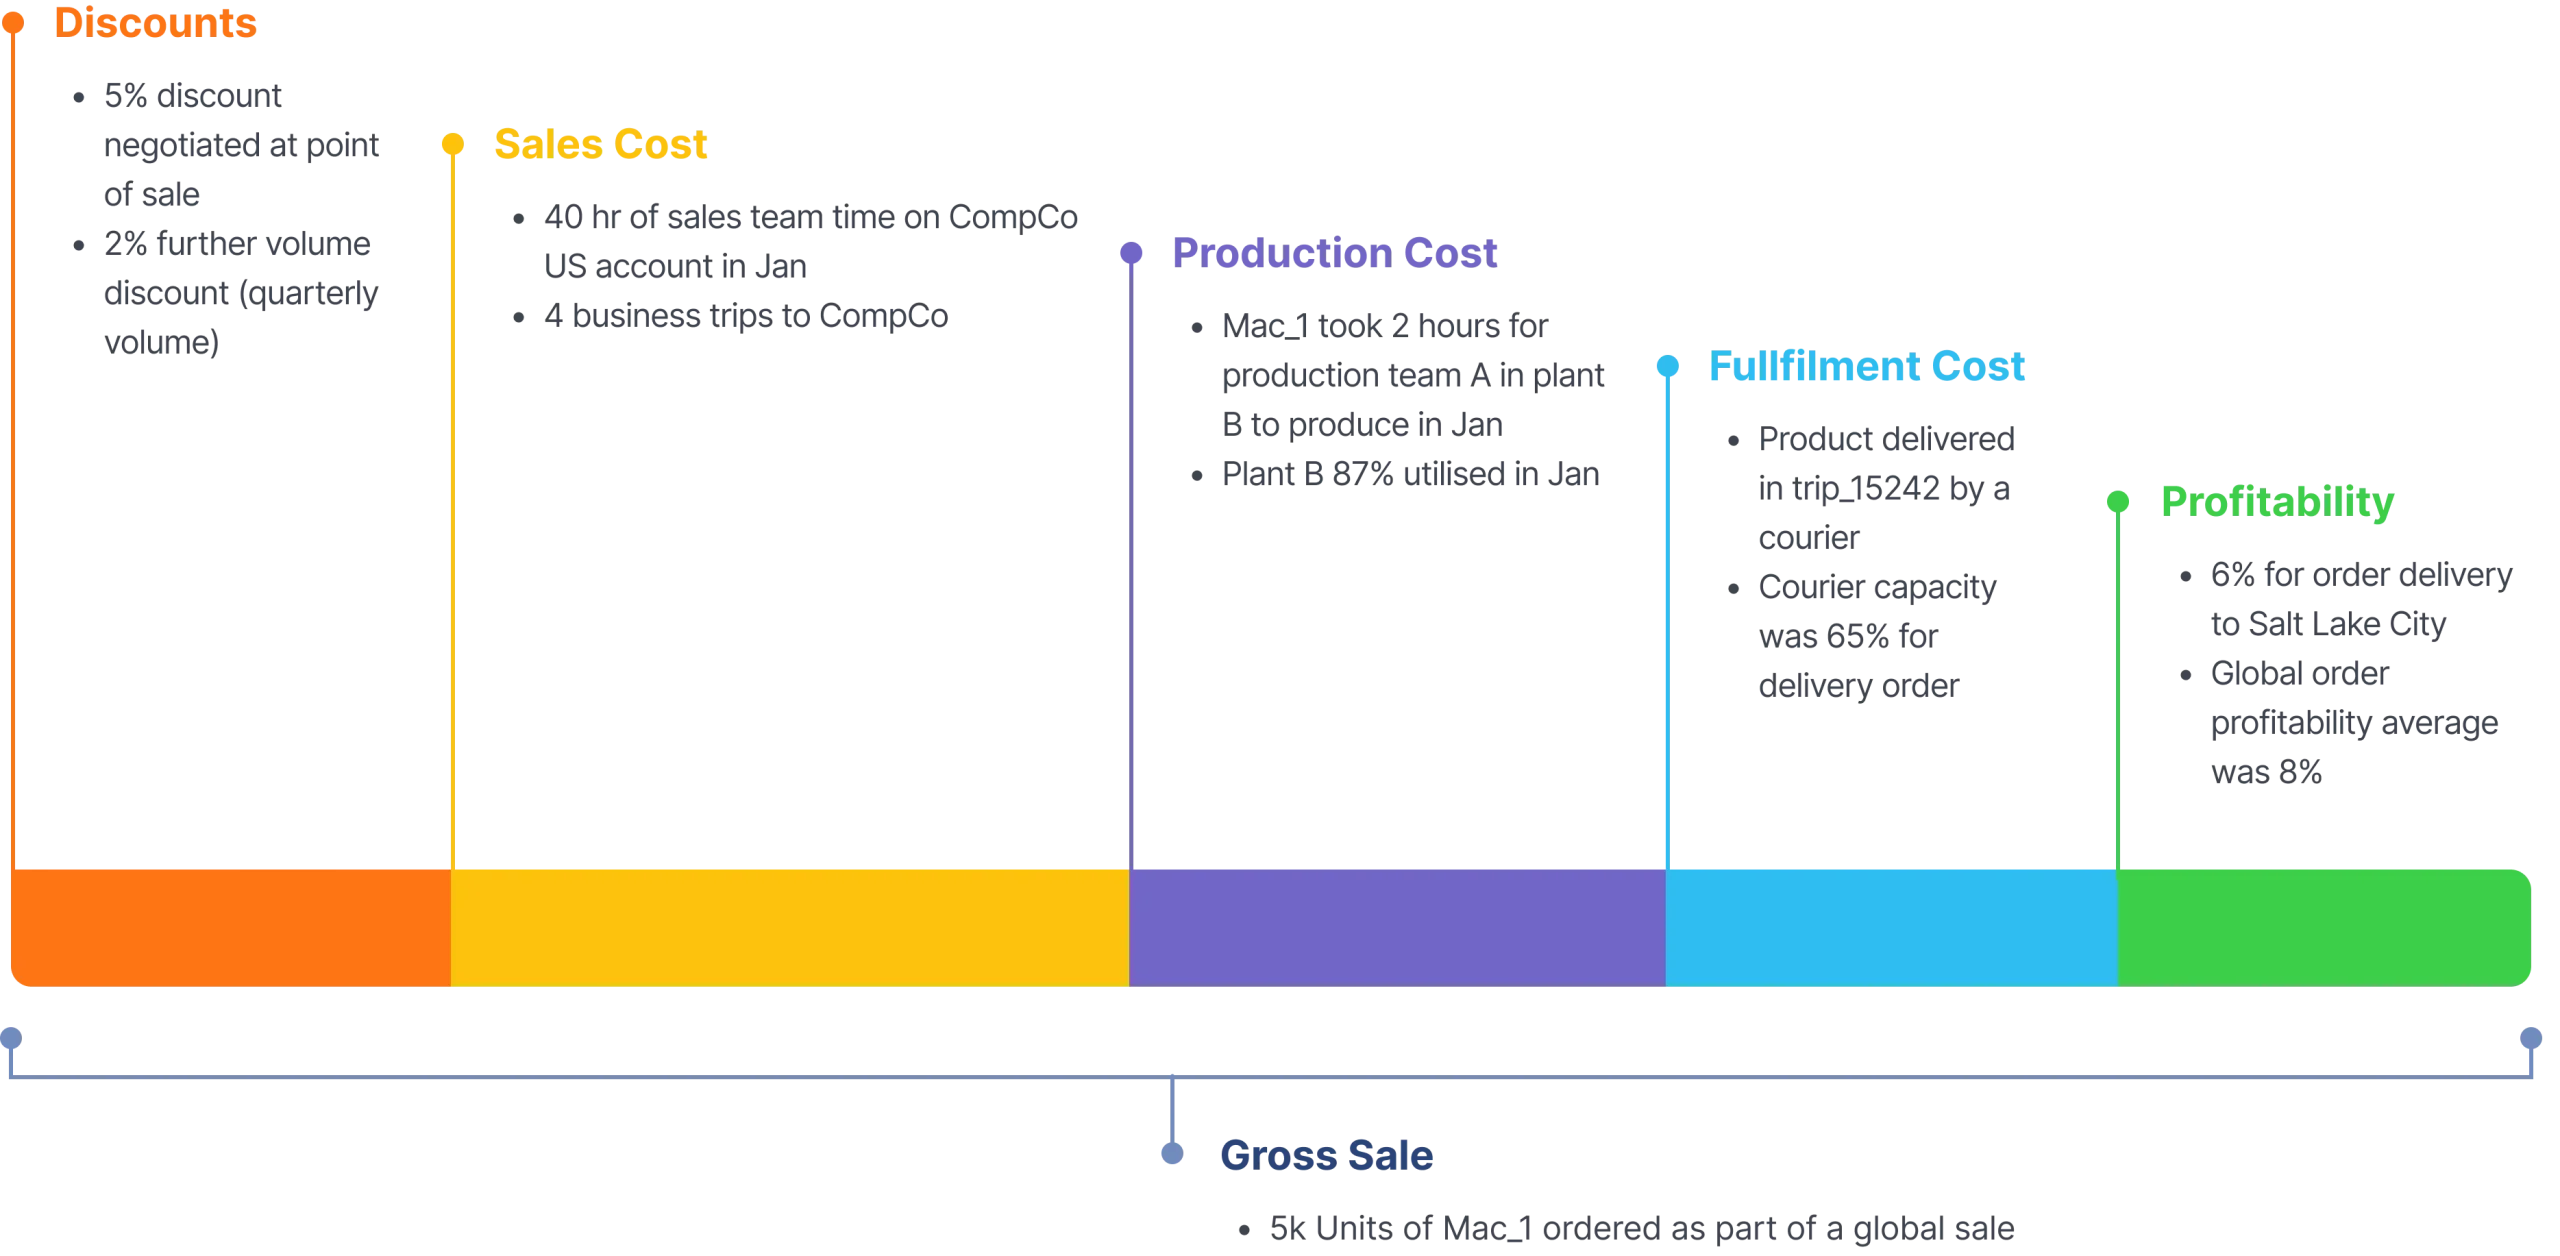
Use case walk-through. The profit made by selling 1 machine of product type Mac_1, distributed to CompCo Salt Lake City, part of an order of 5,000 units total.
5% point-of-sale discount + 2% quarterly volume rebate
40 hours of sales-team time and 4 business trips to CompCo
Mac_1 took 2 hours in plant 4; Part B 8.97% utilized
Product delivered by courier; carrier capacity 65%
Final reconciled margin after all allocations
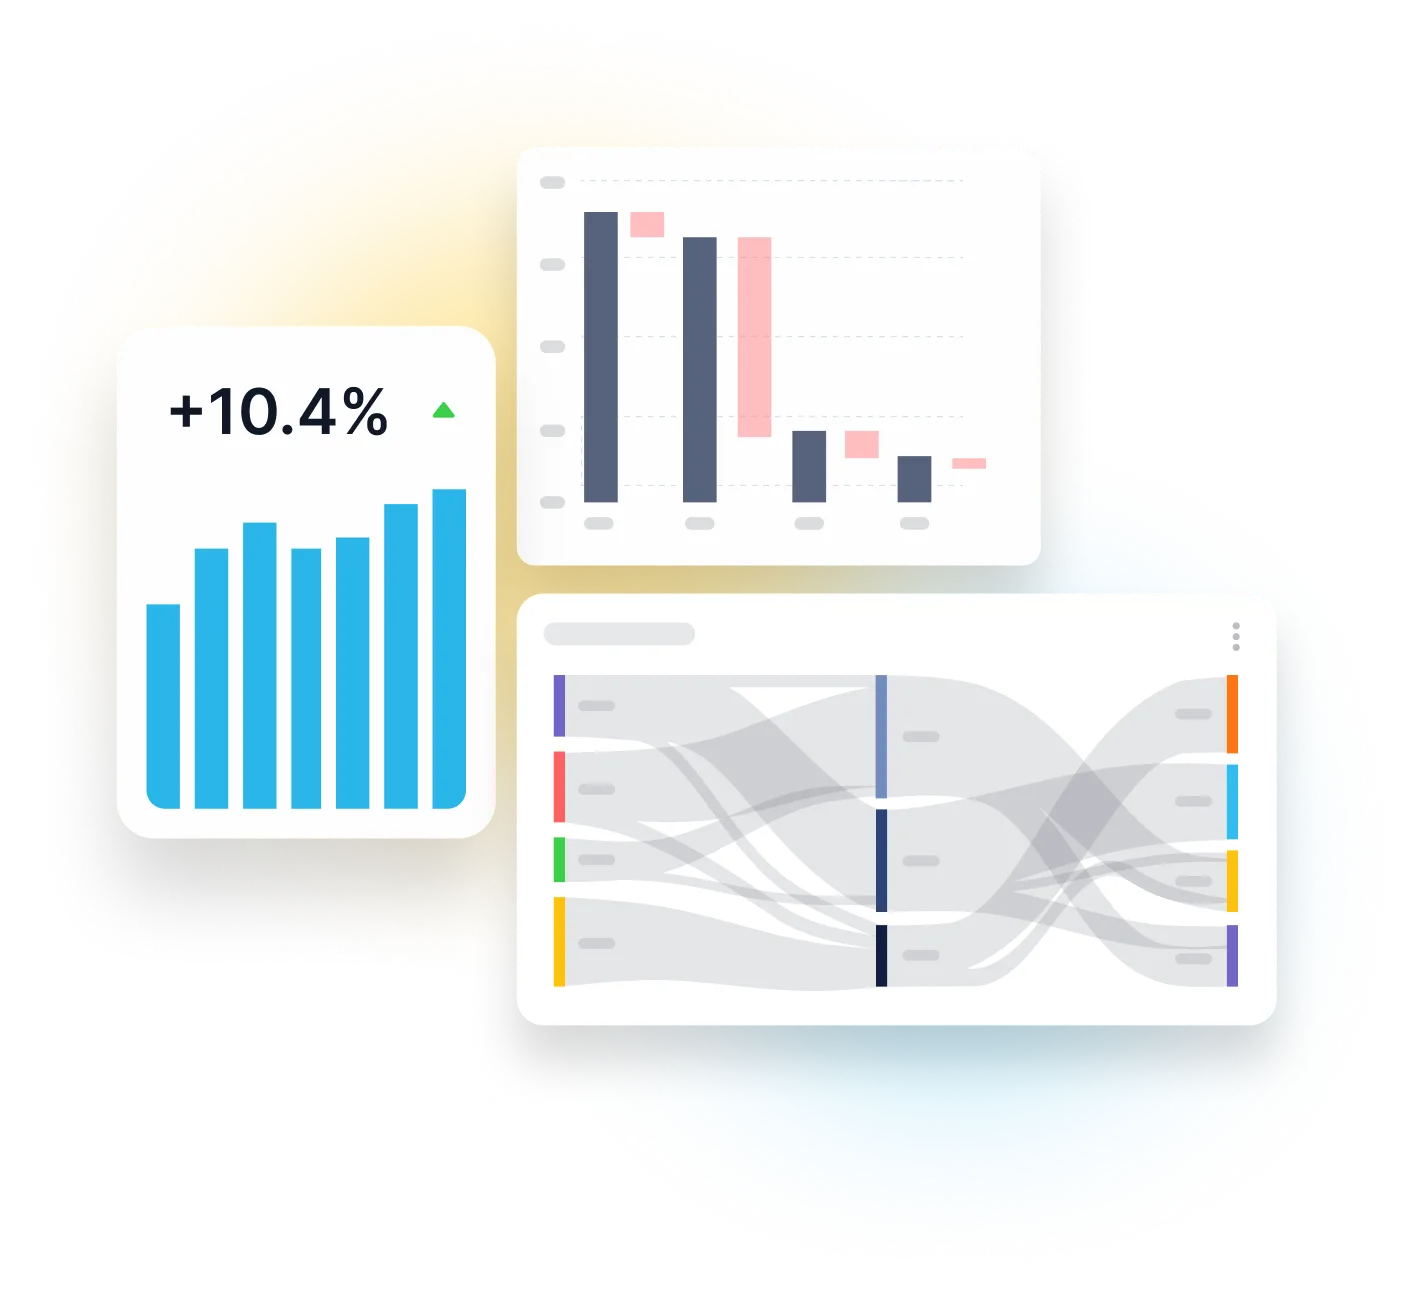
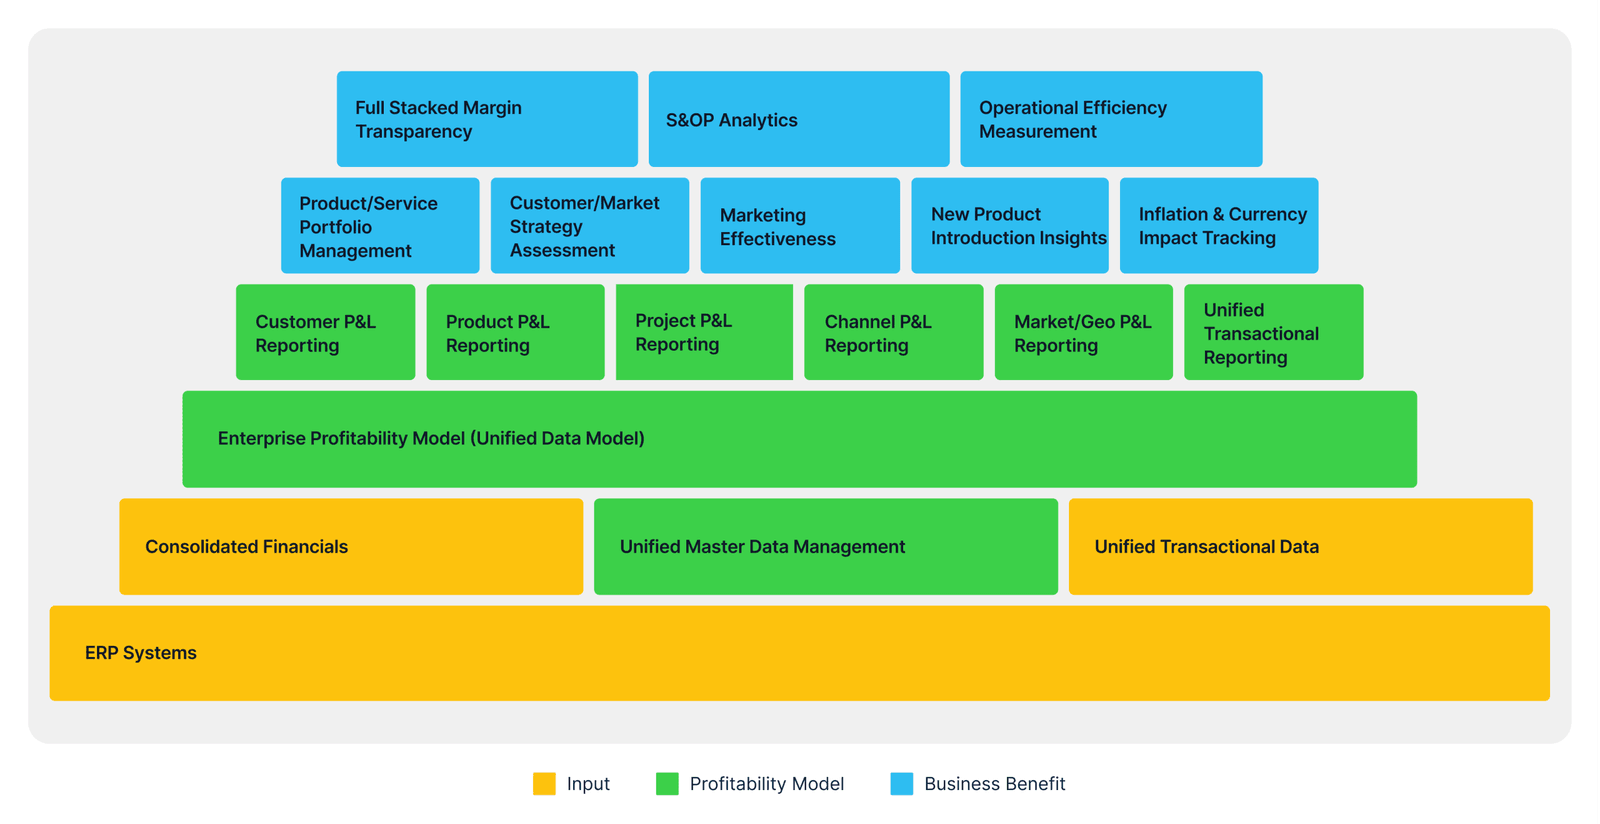
Automate Managerial Accounting From End to End
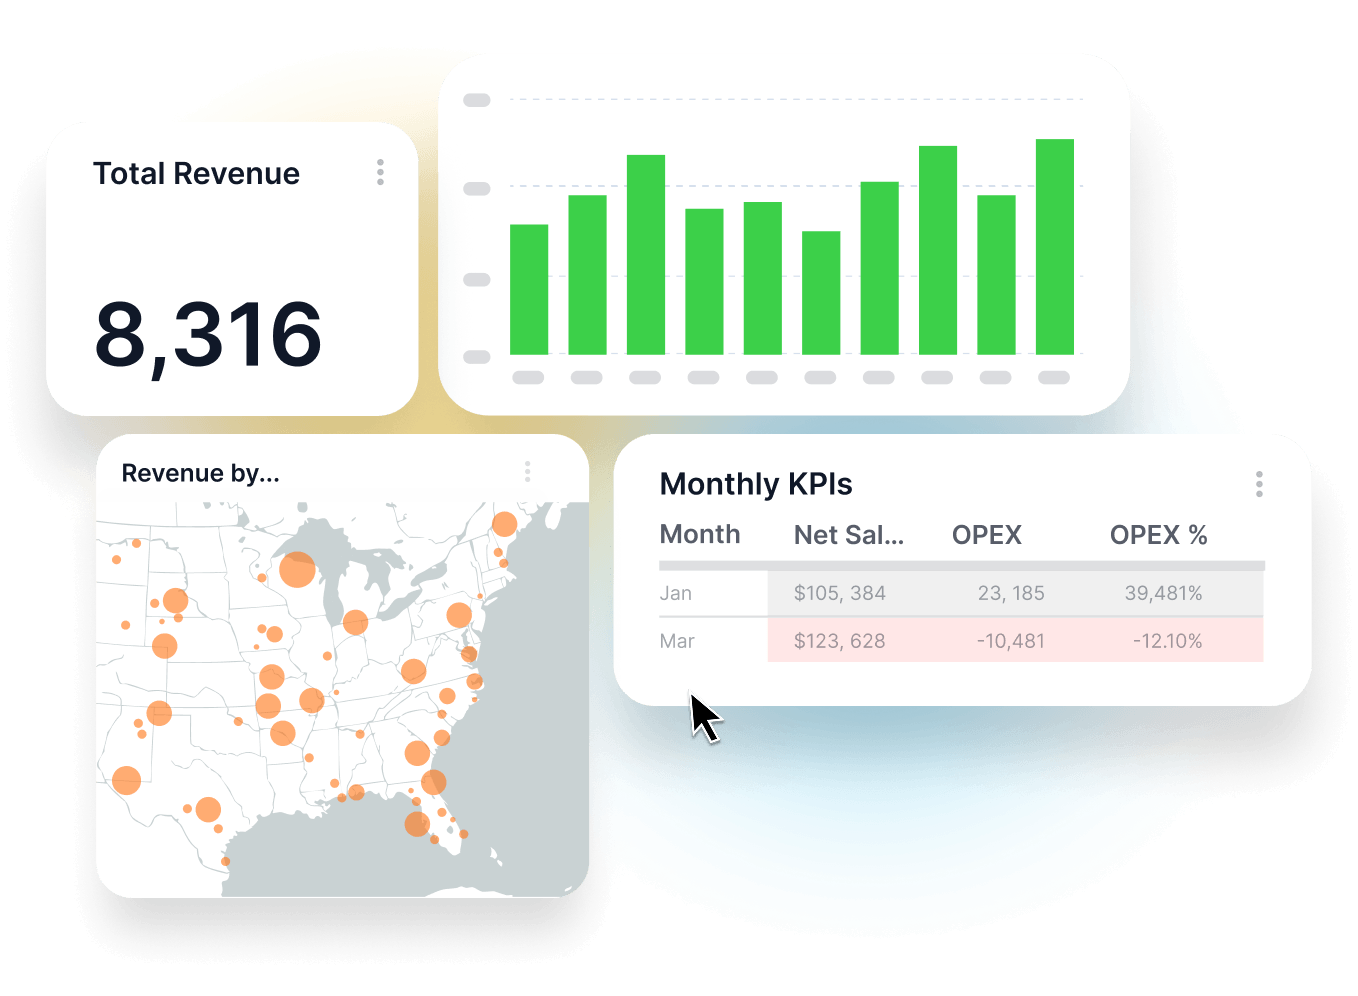
Report revenue, profit, and other key measures by country.
Real-time analytics let teams monitor cost data continuously and make timely pricing decisions.
Automated allocations free finance teams from manual spreadsheets.
Petabyte-ready foundations handle growing transaction volumes without performance loss.
Defensible, Auditable, Explainable
Automate operating-expense allocations across cost centers.
See cost flow across legal entities, regions, and segments.
Trend cost movements over time with drill-back to source.
Live profit dashboards by customer, product, and channel.
Key Benefits
Driver-based allocations across the enterprise.
Customer, product, channel, region, and entity dimensions together.
Point-and-click configuration; no IT tickets to change a rule.
Every output traces back to its source rows.
30 minutes. Your ERP. A walkthrough of what PlaidCloud surfaces that your current reporting can't.
Batteries included. Nothing to install or settings to decide. Everything you need from data collection through powerful transformations to beautiful dashboards, built for speed on any size data.
Automate OPEX allocations, segmented P&L, profit monitoring, price resetting, CbCR reporting.
Learn more →Calculate net margin by customer, channel and product.
Learn more →Generate & post invoicing across multiple systems.
Learn more →Leading data analysis methods, workflows & techniques.
Learn more →Based on standard (ITIL, MOF, TBM) or bespoke framework of your choice.
Learn more →Apache Superset dashboards built straight on your modeled data.
Learn more →Insights